Summary
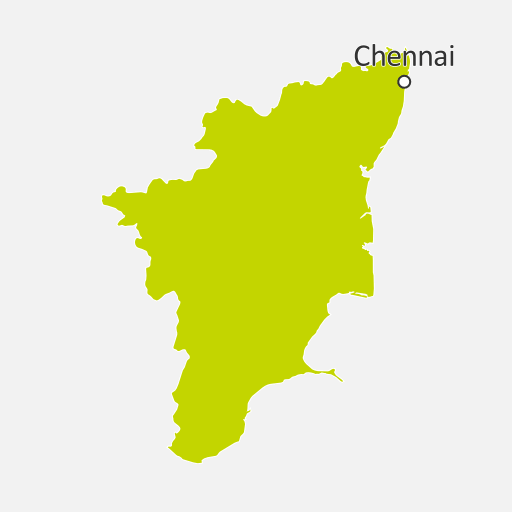
Tamil Nadu ranked second among the 10 Indian states included in Climatescope 2014. It scored 1.20 and performed best on Parameter I, Enabling Framework because of a very high share of clean energy in installed capacity. The state also has welldeveloped manufacturing value chains in the biomass, wind and solar sectors.
Tamil Nadu is one of India’s most industrialized states, with the result that services constitute more than two-thirds of its $142bn economy. The state attracted $363m in clean energy investments in 2013, a small fraction of the $8.4bn that flooded into the state from 2006–13.
In 2013, Tamil Nadu produced an estimated 80TWh, although not all of this was consumed within the state. Coal-fired plants supplied the bulk (66%) with renewable capacity contributing a significant 17.5% (and 41% of installed capacity). The state’s distribution utility, The Tamil Nadu Generation and Distribution Corporation, is in poor financial health and has a ‘B’ rating issued by the Ministry of Power.
Tamil Nadu was once regarded as India’s leading wind power state. It has the largest installed wind capacity (7.2GW), and the sector accounts for 82% of all dollars invested and 86% of its 8.4GW clean energy capacity. However, it has lost some of its shine recently because of issues such as low feed-in-tariffs, power evacuation and payment delays. New installations in 2013 were a mere 77MW, down from 540MW in 2012 and 1,093MW in 2011.
The state conducted a 1GW solar auction in 2013, which was generally deemed to be unsuccessful due to low developer interest and delays getting projects underway. Still, its historical strength and well-developed value chains mean that it performed well relative to other Indian states.
Performance
- State Rank
- %% statsCtrl.stateStats.state_ranking | leadingZero:2 %%
- Score
- %% statsCtrl.stateStats.value | round:2 %%
In detail
- Score
- %% param.data[0].value | round:2 %%
- Rank
- %% (param.data[0].overall_ranking || param.data[0].state_ranking) | leadingZero:2 %%
| Parameter | Rank | Score | Value | Info |
|---|---|---|---|---|
| %% ind_group.name %% | ||||
| %% ind.name %% | %% ind.data[0].overall_ranking || '-' %% | %% ind.data[0].value | round:3 %% | %% (ind.data[0].raw.value | round:3) || '-' %%%% ind.data[0].raw.unit %% | Info |