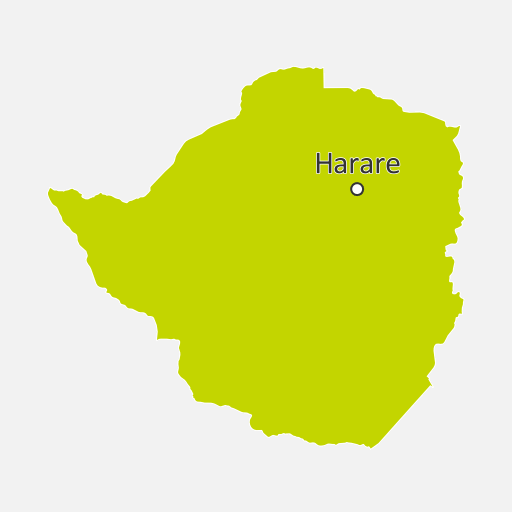
Description
Zimbabwe scored 0.76 and placed 43rd on Climatescope 2014.
It had its strongest performances on Low-Carbon Business and Clean Energy Value Chains Parameter III and Greenhouse Gas Management Activities Parameter IV, achieving its best score within the distributed clean energy service providers and carbon offsets historical activity indicators.
The country received no clean energy investment in 2013, but from 2006-12 attracted a total of $372m. The majority of this investment was in the biofuels sector, which accounted for $327m or 88% of the total in that period. Small hydro made up the remainder. The clean energy sector has been bolstered recently with the entrance of independent power producer Nyangani Renewable Energy, which is in various phases of developing a small hydro portfolio worth just under $50m.
In 2013, the government released the final version of its draft feed-in tariff policy, which will be available for projects up to a maximum size of 10MW. As of the third quarter of 2014 there was no indication of when the policy will come into force. In February 2013, the government released an updated blending mandate to reduce the country’s reliance on diesel and gasoline imports.
Performance
- Overall Rank
- %% statsCtrl.countryStats.overall_ranking | leadingZero:2 %%
- Regional Rank
- %% statsCtrl.countryStats.regional_ranking | leadingZero:2 %%
- Score
- %% statsCtrl.countryStats.value | round:2 %%